At The Quarter Pole: Team Statistical Breakdown
Page 1 of 1
 At The Quarter Pole: Team Statistical Breakdown
Just another person's take. More grist for the mill, if you will. Some stats I haven't seen before.
http://www.celticsblog.com/2013/12/5/5174536/at-the-quarter-pole-team-statistical-breakdown
At the Quarter Pole: Team Statistical Breakdown
By Eric Weiss @EricWeiss_SA on Dec 5 2013, 1:04p 25
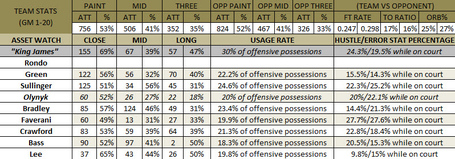
Using SAP's statistical interface on NBA.com, we will take an in-depth look at how the team has performed at each of the four 20 game quarters of the season. At the conclusion of each quarter, we will compare performance from the previous quarter's results. At the end of the year we will then review the progression/regression that occured throughout the year.

KEY TEAM STATISTICS
- 59% conversion allowed at basket - 10th best in league, 28.5 shots/game at basket - 4th worst in league
- 27% opp offensive rebound rate - 5th worst in league. Down from league-worst 32% over first 10 games
- 33% conversion allowed from 3 - Top 5 in league, 12.6 shots/game allowed - .2 more than league-leading Pacers
- 17 turnovers per 100 possessions - 5th worst, 16 TO forced/100 poss is 13th, (0.9 away from 7th)
- .247 FT Rate - 5th worst in league. .298 OPP FT Rate 11th worst in league
- 57% at-basket - 6th worst in league w/ 7th most shots, 42% in paint - 6th best in league w/ 10th most shots
TEAM SUMMARY
Defensively, the Celtics are trending in the right direction. Despite having a predominantly undersized frontcourt rotation, Boston has been able to limit the conversion efficiency of opponents rather well close to the basket. The perimeter defense has also been stout in terms of limiting the damage done from beyond the three-point arc. Overall, this has led to an effective team defensive effort when it comes to defending the initial possession.
However, the team has also given up a significantly high volume of total shots at the basket, despite limiting the overall efficiency of the opponent on those shots. This is not surprising, considering Boston is giving up the 5th highest percentage of offensive rebounds and the 11th highest opponent free throw percentage. Adding it all together, it seems as though the team is having trouble with it's weak-side, "help-the-helper" defensive rotations when the perimeter defender closes out on the three-point line. The initial interior rotations have been solid on the whole, denying quality looks on the inside. But, there have been fundamental breakdowns when it comes to covering bodies after the first shot has been taken.
Overall, there has been substantial improvement in terms of defending the offensive glass, which has led to a decrease in both opponents offensive rebound rate and free throws generated. This trend should continue as familiarity grows, though it will be interesting to see if success plateaus due to lack of length represented on the court. It's commonly accepted that length is the premium commodity for effectively defending the rim. That theory will be put to the test if Boston's current distribution of minutes remains relatively the same.
Offensively, Boston has really begun to dig itself out of the three-point shooting hole it was in to start the year. the team is now up to 35%, after hovering around 29% during the first ten games of the season. Boston's mid-range game has also stabilized at a respectable 41%
ASSET WATCH
- Jeff Green accounts for 30% of the total fouls drawn when he is on the court and is one of 15 players generating over 16.5 points/game while possessing the ball less than 2 minutes per game. Green ranks 4th of just 5 wing players in this category with .43 points generated per half-court possession. There are 43 players league-wide who average over 16.5 points/game and 30 minutes/game. Green garners the 4th lowest amount of offensive touches in this group and ranks 1st in shots in the paint and 2nd in free throws among the wings ranking in the top 10 least touches.
- Jared Sullinger is accounting for 26% of fouls drawn, 25% of blocks, and an impressive 32% of total rebounds when he is on the court. Sullinger's rebounds-per-chance rate of 64% is 16th of 58 NBA players with a minimum of 10 chances-per-game, ranking only fractions of a percent behind Kevin Love. Sullinger only generates 11.6 chances-per-game, ranking 44th in this group. However, his 26 minutes-per-game average ranks 54th overall. Normalizing for minutes-played, Sullinger is generating .45 chances-per-minute compared to Love's .60 average.
- Kelly Olynyk has an incomplete 1st quarter due to injury. There are some encouraging elements to his body of work thus far, based on some of the question marks he had coming into the league. He is accounting for 29% of all rebounds and 20% of all assists when on the court, while responsible for a team-high 25% of the turnovers. Olynyk has an at-basket conversion rate of 63%, which is above average and encouraging considering he's been matched up mostly on centers, where he doesn't have a length or size advantage. Olynyk's DRB% puts him in the company of Noah, Hibbert, Smith, Nene, and Pekovic, while his ORB% is virtually identical to Sullinger's.
Defensively, Olynyk has a ways to go. his 60% conversion rate at-basket is poor, but is better than the more seasoned, more athletic, and more heralded Sophomores Drummond, Valanciunas, and Anthony Davis. The rangy Davis serves as an excellent comp for Olynyk as he's not a true center. The highly regarded Davis rates worse in each defensive spacial zone. This fact has no conclusive value, but does offer an enticing perspective regarding the value of length and athleticism vs. knowledge and team scheme when it comes to a player's defensive impact.
- Avery Bradley only accounts for 12% of fouls drawn with a usage rate of nearly 24%. Bradley is shooting just 48% cumulatively from inside the paint, but his 54% at-basket rate is creeping toward respectability. The cumulative total is up from last season's 43% rate. Bradley's Mid-range game is well-above league average at 46%, but only slightly better than last season's 43%. Bradley's Left/Right/Break splits from three-point land stand at 41/27/20 vs. 38/33/16 from last season.
- Jordan Crawford is accounting for an astounding 46% of all assists when on the court. This is more indicative of the poor overall team assist ranking - last in the league - then elite playmaking, but still solid. Crawford ranks 10th of 156 players in points off of pull-up jumpshots/game. Crawford's spacial efficiency's are decent overall, but his uncanny ability to shoot off of the dribble ranks 7th out of 25 players who have scored at least 90 points off the dribble. Crawford's 46% eFG on these shots is tied with Steph Curry among league leaders.
- Vitor Faverani is accounting for 60% of all blocks, 33% of rebounds, and 21% of fouls drawn when on the court. However, he is also responsible for 33% of all fouls and 22% of all turnovers as well. His 44% Opponent FG at rim ranks 12th out of 48 players who face at least 5 shots at the rim and play over 15 minutes/game. A lot of activity, a lot of ups and downs for Vitor's first dip into the NBA game.
- Brandon Bass has accounted for 23% of all rebounds and 38% of all blocks when on the court, while only being responsible for 11% of all turnovers. Bass mid-range efficiency ranks 12th out of 156 players who play at least 25 minutes/game. Compared to last season, Bass has dropped from 4th in mid-range efficiency. However, seen a 5% increase in his points in the paint with a massive increase in unassisted points scored - jumping from 25% to 49%. He is creating more offense for himself with a limited decrease in efficiency.
Defensively, there are only 27 Forwards who have defended over 200 shots at-basket, 150 mid-range, and 150 above the break. Of these three spacial zones, Bass ranks 12th at-basket, 18th mid-range, and 1st above the break. The range of defensive coverage is extremely impressive and places him above noted defensive stalwarts such as LeBron James, Nic Batum, and Josh Smith in terms of diversity/volume of shots faced and opponent conversion rate.
- Courtney Lee has shot the ball extremely well from all three spacial zones this season. However, he has not been particularly impact in any of the measurable "hustle" statistics either. Lee's efficiency within his limited opportunity is the most impressive element of his season to date. There are 63 players averaging between 15-20 minutes/game Among these "situational-subs", Lee ranks 7th in eFG%, 7th in pull-up, 15th in catch-and-shoot, and 12th on drives.
Defensively, there are only 35 guards coming off the bench who have faced at least 100 shots at-rim, 100 mid-range, and 50 above the break. Of these three spacial zones, Lee ranks 6th at-basket and 7th above the break. Lee is only 34th against mid-range shots. However, the team defensive scheme requires guards to take away the three, which leaves them susceptible to pull-up shots by their man. Both his close and long range defensive efficiency alludes to sound decision-making within the team scheme.
On the whole, there are a mix of positive and negative elements at play within this team. But, considering what popular sentiment was to begin the year, both the team and its players seem to be off to a good start. We'll check in for mid-terms in another 20 games and see if things continue to trend upward.
bob
.

bobheckler- Posts : 61300
Join date : 2009-10-28
 Similar topics
» The Boston Celtics, AS A TEAM, at the Quarter Pole
» 1st Quarter Woes - Shot Chart Breakdown, Team
» Rank Of Force, At the Quarter Pole
» Grading Boston Celtic Players, at the Three-Quarter Pole
» At The Quarter Pole, Time For Celtics To Make Their Moves
» 1st Quarter Woes - Shot Chart Breakdown, Team
» Rank Of Force, At the Quarter Pole
» Grading Boston Celtic Players, at the Three-Quarter Pole
» At The Quarter Pole, Time For Celtics To Make Their Moves
Page 1 of 1
Permissions in this forum:
You cannot reply to topics in this forum|
|
|
